
Home / Analyse and Report
Analyse and Report
Everything you need to synchronise your team and their activities in one environment
Report Generation
Data export and report generation
Export your data as an Excel file to analyse the information gathered from one or multiple selected checklists, this will allow you to conduct a comparative analysis.
Generate PDF reports or simply tweak any necessary changes in a downloadable Word document before forwarding it to teams, clients, and buyers. Customise the report contents by choosing a format and the page setup items you need. Items include options such as logos, disclaimers, confidentiality visibility, attachments, issue summaries and more.
Utilise these reports as data overviews, credible legal documentation and progress reports.


Simple Dashboards
Visually representing data can be quite time-consuming, which is why Iristrace offers you an intuitive and interactive data query that enables you to chart checklist progress:
- Select one or more templates involved in evaluation
- Define tags that qualify the data presented
- Choose the data source to be measured
- Test and decide upon the live visual representation
Finally, tweak the layout by changing the size and positioning of the created data representations to put everything you need into one or multiple dashboards. These adaptable overviews can be exported and ensure that you are in control of all your processes at all times.
Advanced business intelligence tool already provisioned
Within the Iristrace set of services inside your private instance, you can optionally benefit from the provisioning of a full analytical dashboard that is already connected with your data. It allows you to interactively refer and chart your checklists.
It features its own user administration with analytical roles as well as data view access permissions.
Visualisations include time-series charts, box-plots, radar, sunburst and Sankey charts, maps, data tables, pivot tables and many more.

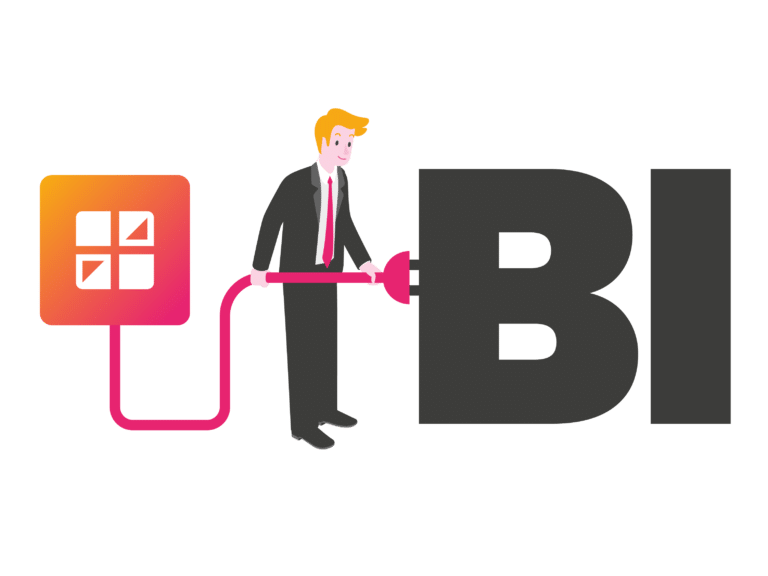
Analytical database for external data visualisation
You can use your existing analytical tools, such as Microsoft PowerBI, SAS, SAP Analytical Cloud, SPSS, R, or Google Looker Studio to access your Iristrace data through a provisioned analytical database as your datasource. Data is being compiled for you with a specified refresh cycle. You will receive a safe access path to your data, further secured through networking restrictions and routing.
For near-real-time transmission of analytical data, the Iristrace team will work with you to establish an event-driven provisioning model. Please contact us for further information.
Automation services and data flow processing layer
Let us help you integrate your different systems.
The Iristrace platform features a full flow processing layer that connects it to virtually any other system. The success consulting team will be at your side to implement your data flows to and from other systems in your landscape via event-driven ODATA Services, Rest APIs, XML, MQTT or via custom batch transfers.


Technical Customer Support
Our Success Consultants will offer dedicated and personalized support, analyzing your needs to ensure that Iristrace seamlessly supports your business operations. In order to help you get the most out of the platform, our expert consulting services span:
- onboarding your team of end-users
- training and knowledge transfer to your project managers
- digitalizing your processes and forms
- analytical data models
- integration of artificial intelligence (AI) and large language models (LLM)
- dashboarding
- solution extensions
- advanced automation
- integrations with other systems
- IoT connectivity
Your success is our mission.