Features which make Iristrace the right choice
While the explanations provided on the Products pages form the foundation for digitalising and enhancing your operations, these advanced features listed below can further amplify the benefits of using Iristrace.
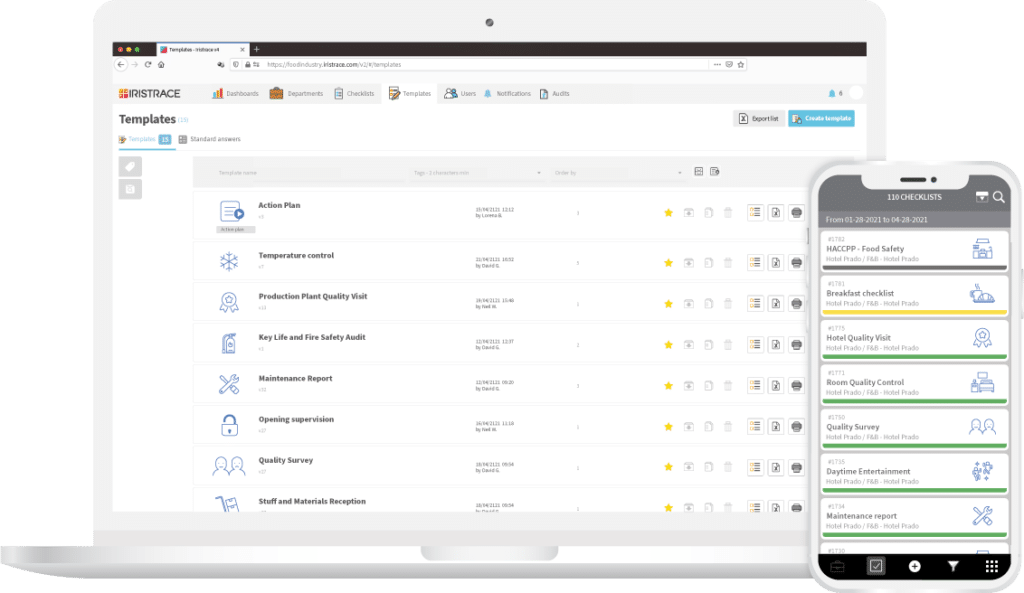
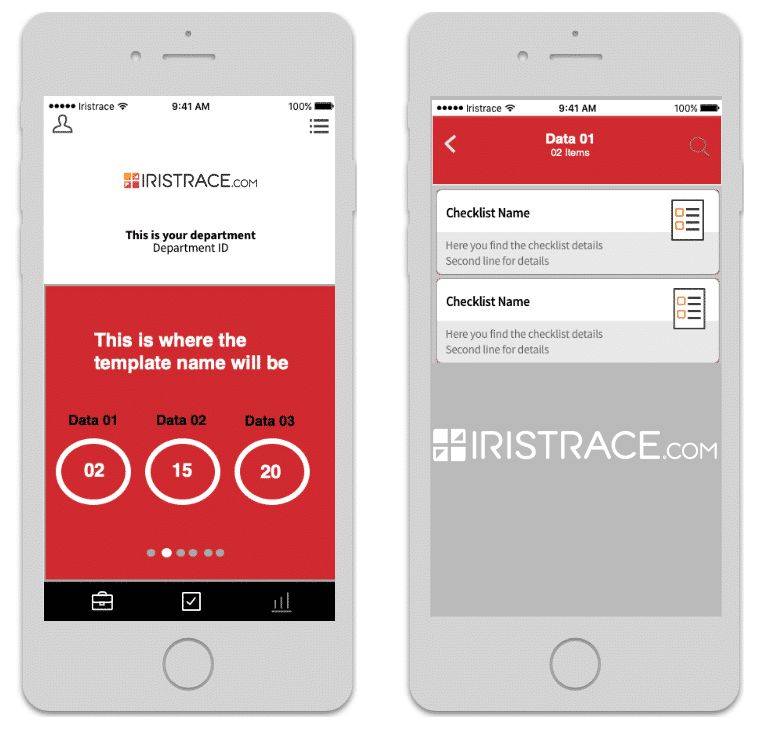
Branding and identity
Tailor the applications interface by integrating your logo and selecting a matching color for both the mobile and desktop version.
Tags for filtering and sorting
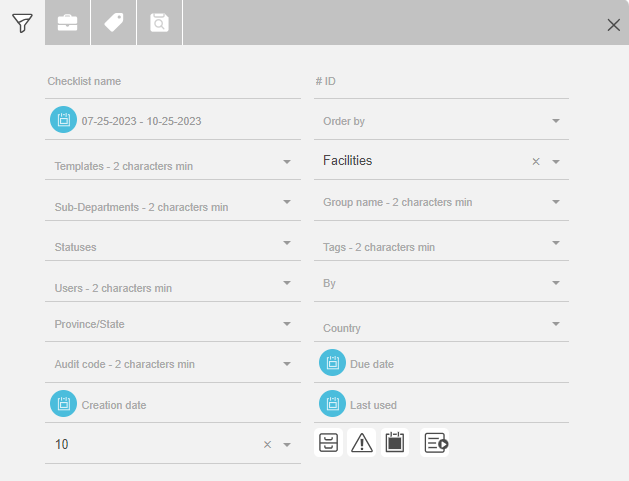
Add tags to your users, assets, items, business units, departments and templates for filtering as well as to help segment your analytical data. Checklists will inherit the tags from both departments and templates when being created saving time, without the need to re-tag checklists individually.
Make tags easily identifiable by customising their colour and optionally the nesting (parent-tag).
Tags are part of the search criteria which can be saved for re-use to save clicks when filtering information.
Role Permissions
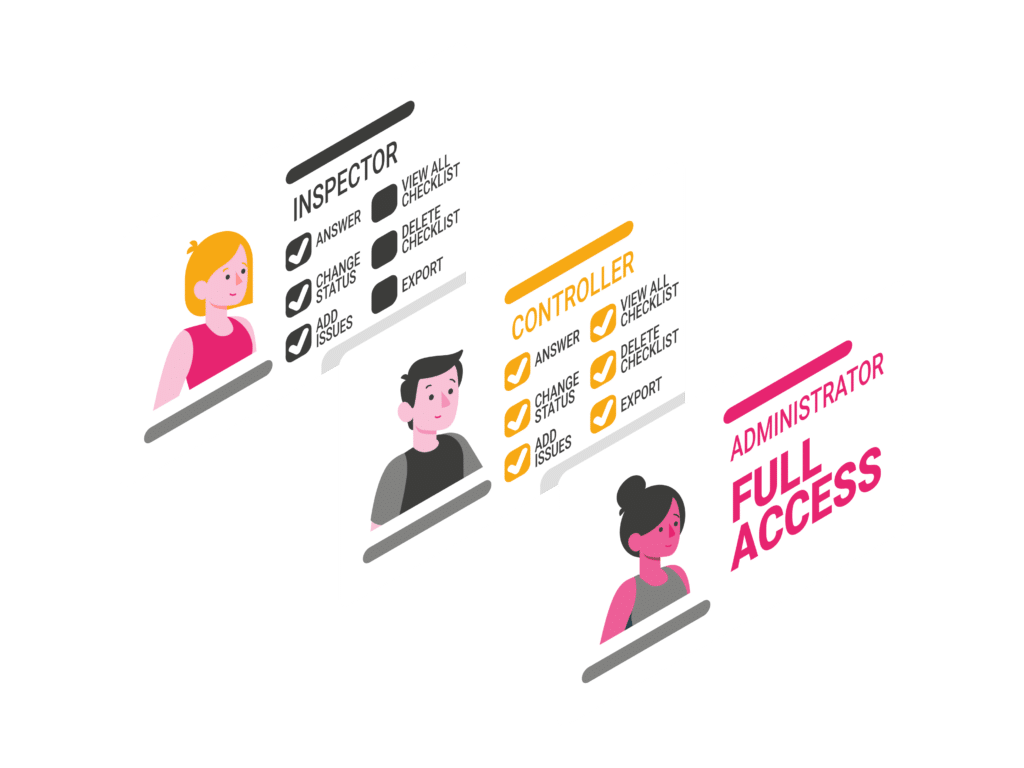
– Role: When adding users, you have to specify their role to grant them predetermined general functional and status specific permissions. After that you can customise these permissions in further detail.
– General functional permissions: these permissions determine the rights to manage or view users, templates, departments, tags etc.
– Status permissions: these permissions control whether a user can read from or write to a checklist depending on its status, or whether a user can assign other users, or change status, add pictures, comments, or action plans.
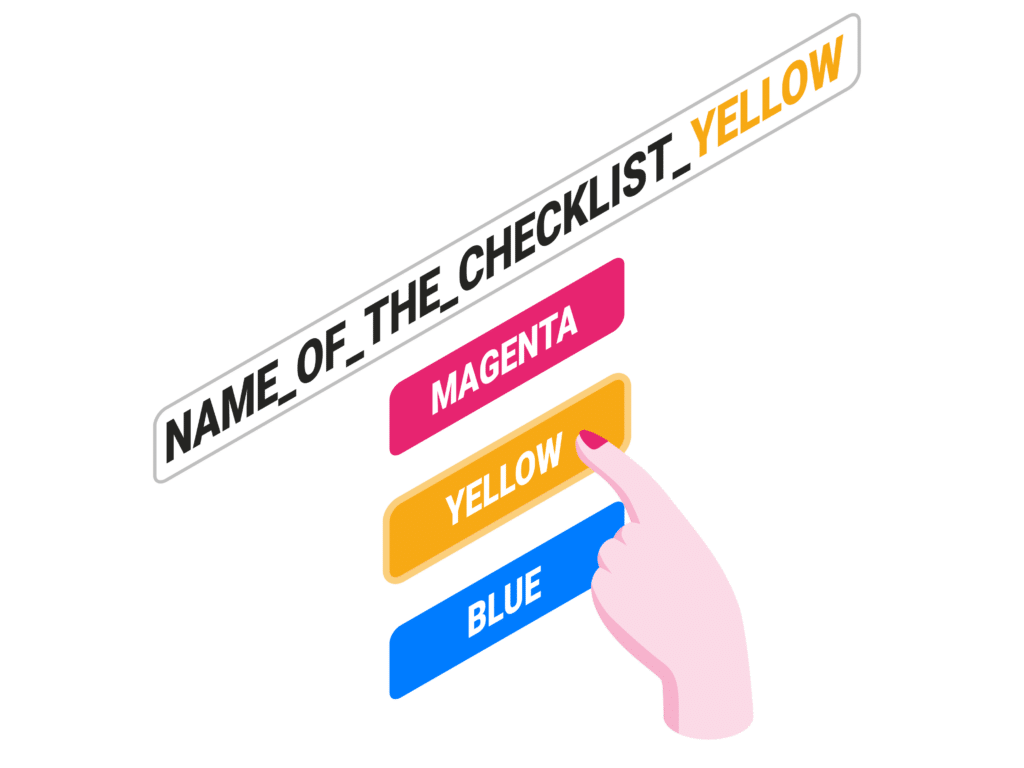
Dynamic Titles
Enabling dynamic titles allows you to have checklist names that change with the answers given. This allows to quickly search for specific results across checklists.
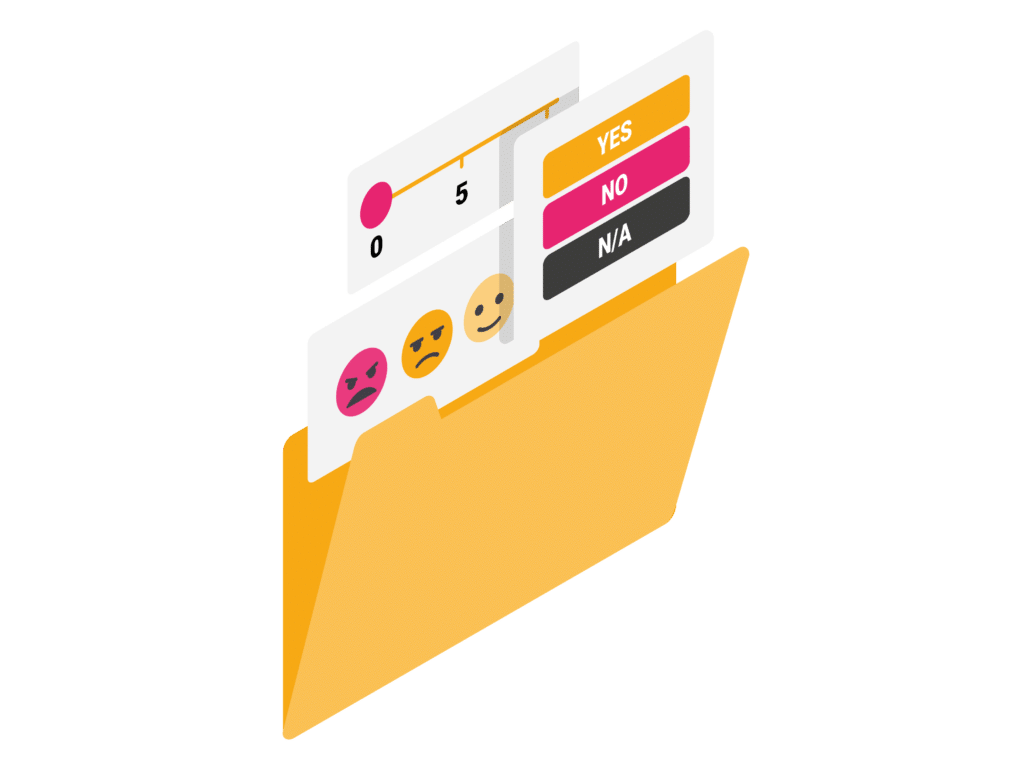
Standard Answers
Save a set of answer options as a standard answer to re-use them in different questions and avoid repetition. It saves time, avoids typos and increases the consistency of your analytic data.
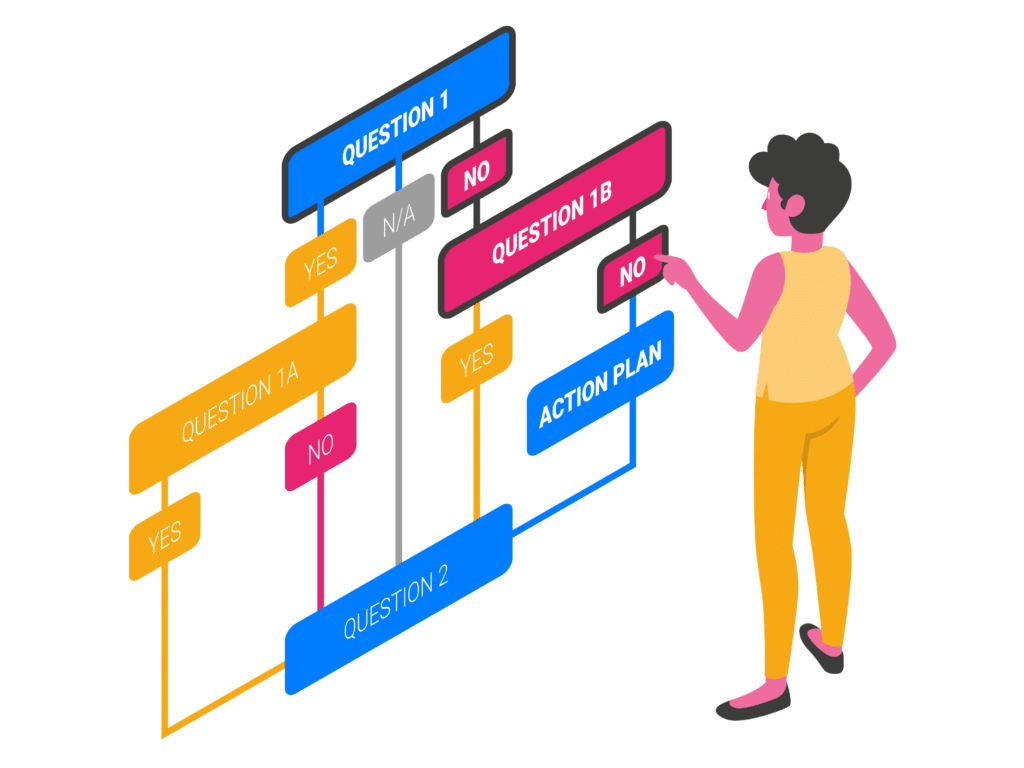
Conditional Logic
Implement conditional logic within templates to dynamically show different questions depending on the answers provided.

Weights and simple Scoring
Add weights to your categories and your answers within your templates to standardise the evaluation of your checklists. This will help you benchmark the performance across your units or departments, and allow you to act quickly on underperformance.
Scores can simply be summed up, or shown as % achievement, using calculated averages. Checklist reports optionally include a summary table of the scores.
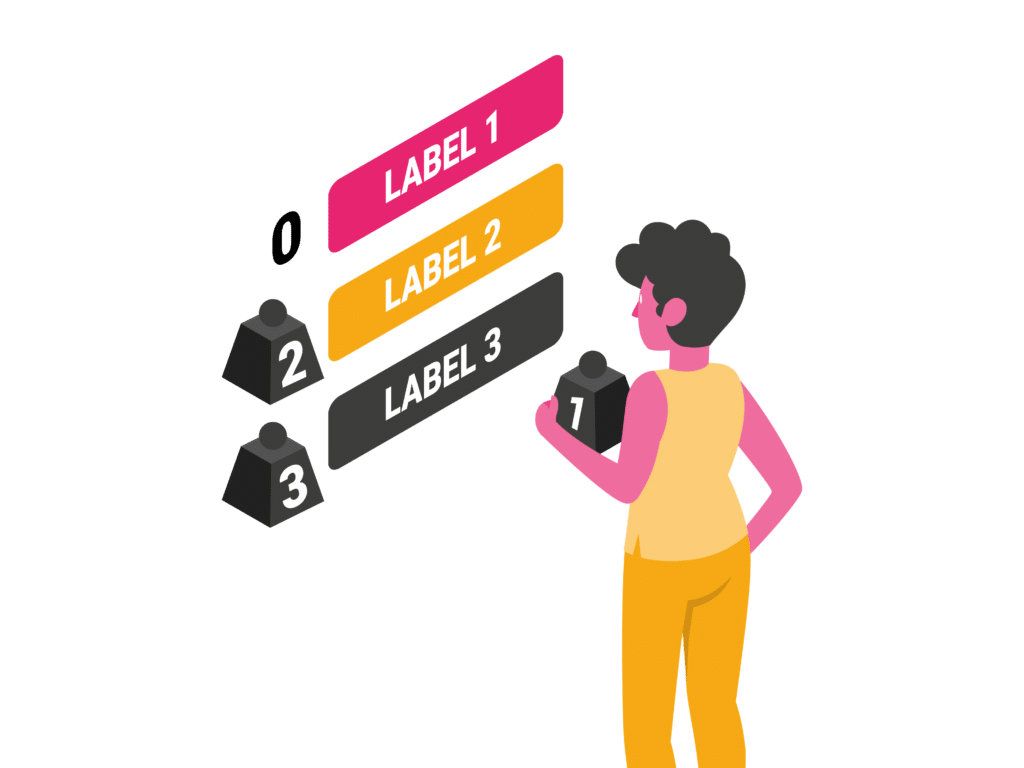
Advanced Scoring
Advanced Scoring allows you to set up a scoring scheme using one or multiple tags to create scoring subgroups. These subgroups can be used to define different levels of aggregation. Each subgroup can be weighted individually for the calculation of the overall score.
The system allows to add or to exclude subgroups in the final calculation.
Status Groups
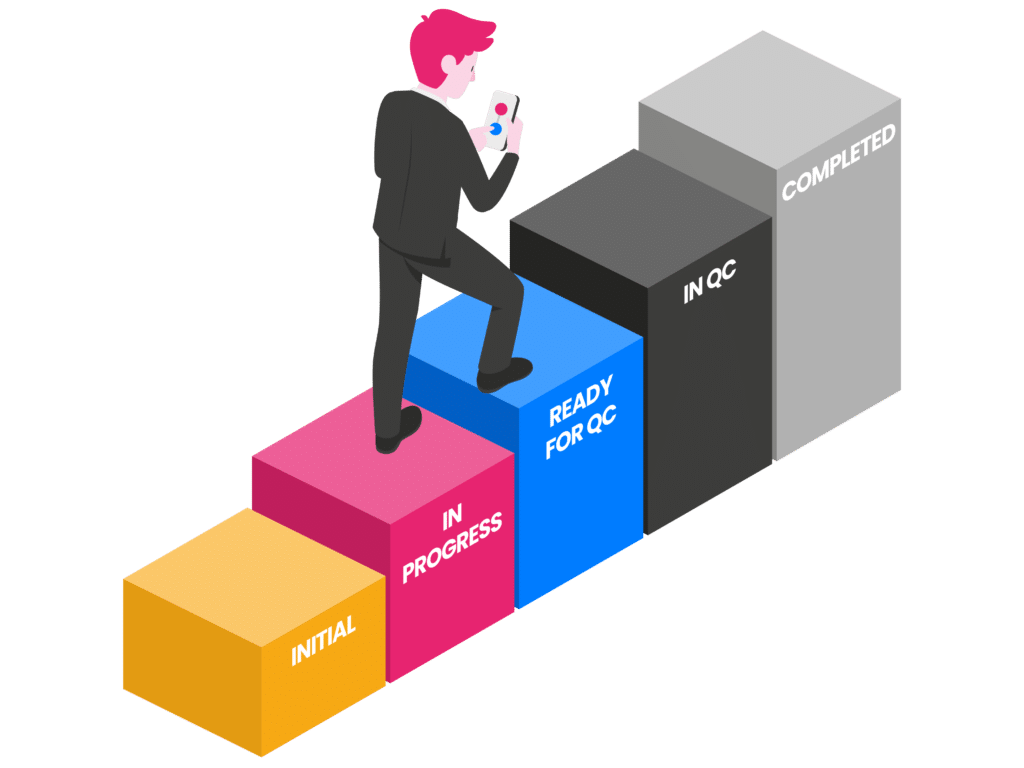
Just like processes consist of different steps, Checklists also have their own sequence of statuses. These are grouped together into “Status groups” and are visible in the Kanban overview or in the checklist data screen. When creating a template, a status group must be selected.
Iristrace ships with a default status group that consists of 5 statuses: Initial, In progress, Ready for QC, in QC and Completed. However, this default group may not be applicable for all of your processes. Therefore, you can create your own statuses, and put them together into status groups to utilise them in your templates.
Statuses follow a flow of subsequent steps, generally ending with a status indicating completion, but other statuses may be needed as well, which can be added outside of the chain. You can add one or more isolated statuses, for example to mark a checklist as cancelled, void, on-hold, duplicate, or in some form of a pending review process step.
For each status you can decide what interaction is permitted for a user (status permissions). Iristrace provides a finely-granular access permission set based on these statuses.


